Using data to improve your event

3 ways to create insights from data

For a narrated audio version of the article:


There is a joke in the event industry that event leaders either believe that they don’t have enough data to make data-crunching worthwhile, or that they have too much data to know where to start.

Whilst this holds some truth, it probably reflects a common anxiety that we either don’t have enough time to look, or to find out where to look first. Let’s look at some simple tips as to what data to collect, and which dials you can move.

Getting started

If you have registration data, entry data, session attendance data and post-show survey data, you already have a great start in tracking attendee conversion and satisfaction.

Most events also try and capture lead retrieval data and meetings planning data, as well as tracking participant activity on social media. This can help you understand the levels of engagement with exhibitors compared to speakers, and to identify influencers in the industry. This can all help target high-value attendees.

Events using Konduko will also have a large sample of attendee behavioural data from the show floor, based on which attendees have collected information from Readers using their badge. This can be used with these other data types to give a rich picture of how your event is delivering value.

Here are some useful analysis opportunities that are possible with large sample behavioural data from interactions on the show floor:

What to invest in to attract the right attendees

Your event stands and falls on whether your Exhibitors and Sponsors get the volume and quality of engagement from attendees. However, your attendee audience has other goals for the event which are contributing factors to their decision to attend. Such as networking, socialising and hearing from industry peers and experts in talks. Whilst these activities may not directly drive engagement with your Exhibitors, you need to know if investing in them is attracting the kind of attendees that are engaging with Exhibitors, so you can target the ones that are most valuable as prospects for future events.

By combining show floor behavioural data with session attendance data, you can understand:

  1. Which attendees visited sessions but did not engage on the show floor. 
  2. Which attendees visited sessions then visited Exhibitors with related products.
  3. Which sessions drew the most attendees that engaged well on the show floor.
  4. Which sessions were the most popular, regardless of which categories they were interested in on the show floor (hero content).
  5. Which Exhibitors were the most popular with attendees, regardless of their interest categories from the show floor (de facto bellwethers).
  6. The impact of putting the most popular speakers at the beginning and end of day slots. Did those attending these sessions extend their overall engagement with Exhibitors because they arrived earlier and left later in general?

Attendee engagement insights can then help you target your marketing to attendees, by offering incentives and targeted campaigns to those with the highest value. You can also target speakers and offer favourable terms to Exhibitors based on their influence on high value attendees.

Remember though, that just because you didn’t visit the show floor doesn’t mean you won’t visit it with the right encouragement, because after all the session data provides topics of interest, so you can create campaigns to target individuals with known interests about Exhibitors in that space.

Customer satisfaction data can add an extra dimension to behavioural data, since you can classify attendees in terms of what they interact with and their average satisfaction. 

And remember if you have accurate behavioural data, you can make surveys shorter and increase the sample size for those completing.

Increase sales from rebooking

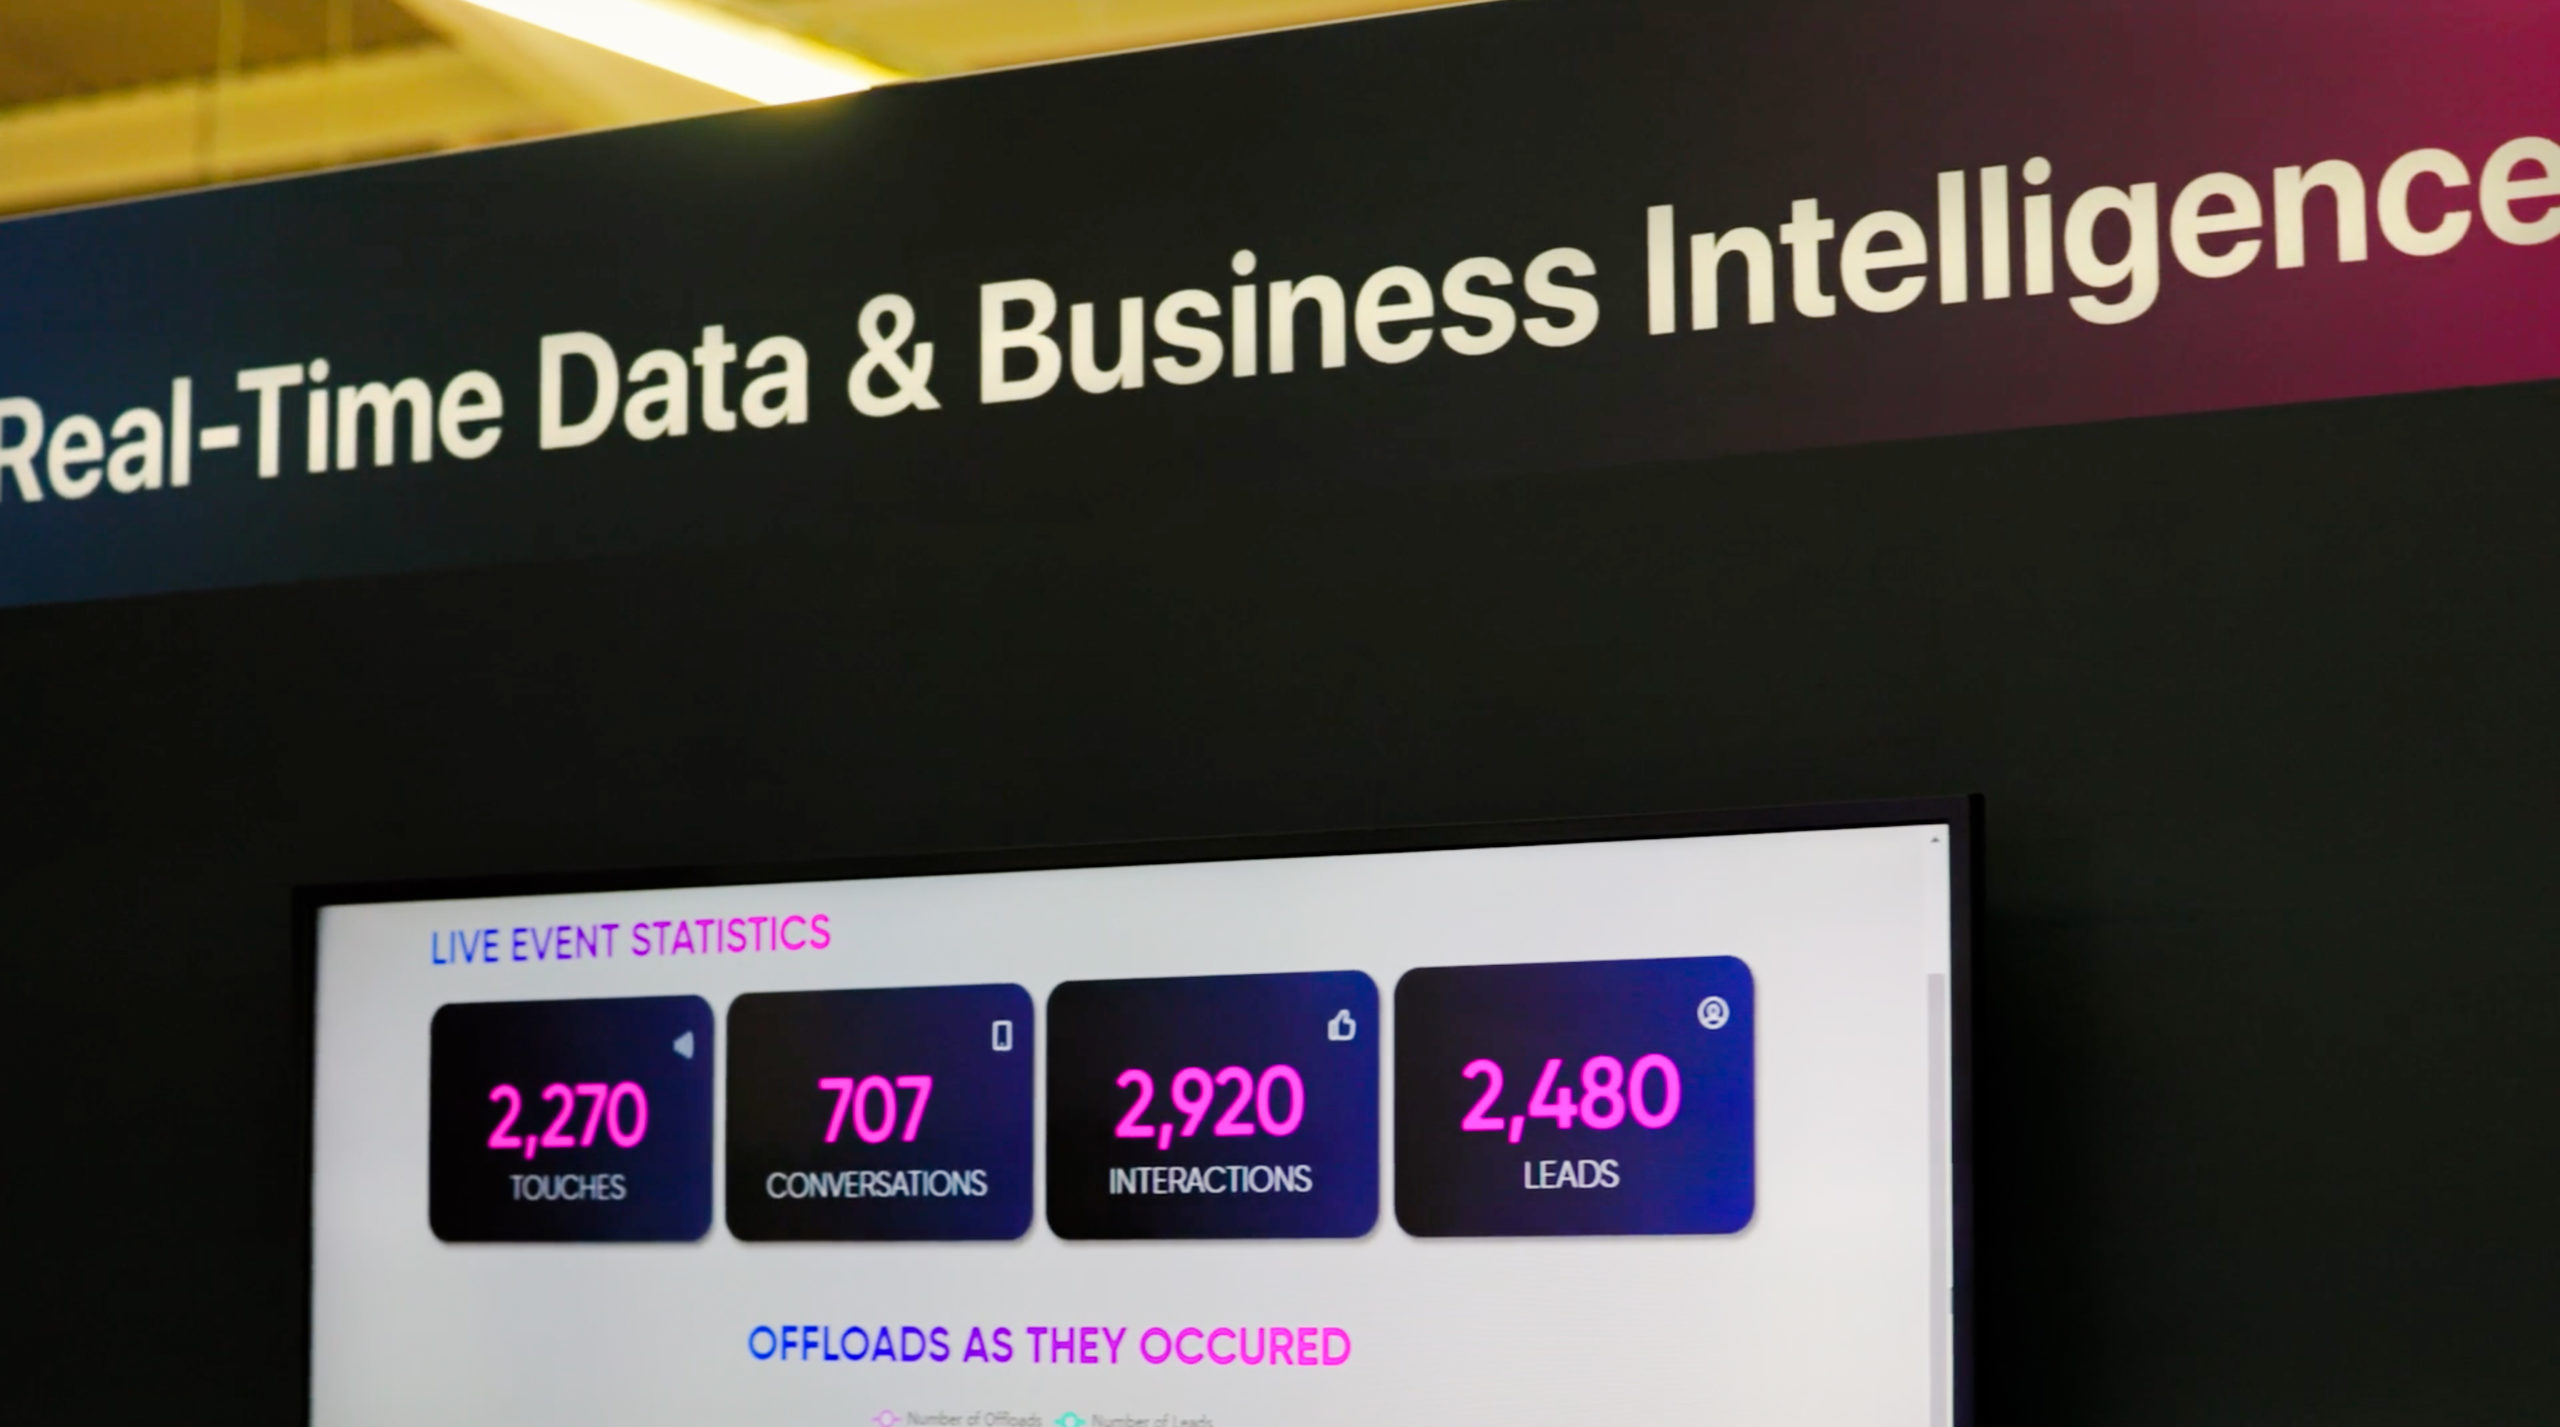
Use data about attendee engagement in real-time to inform your sales team for those to help and those to sell to.

Anyone managing data and metrics is looking for leading indicators – the metrics which give you insight before the event itself. For examples the volume of registrations is a leading indicator of event attendance.

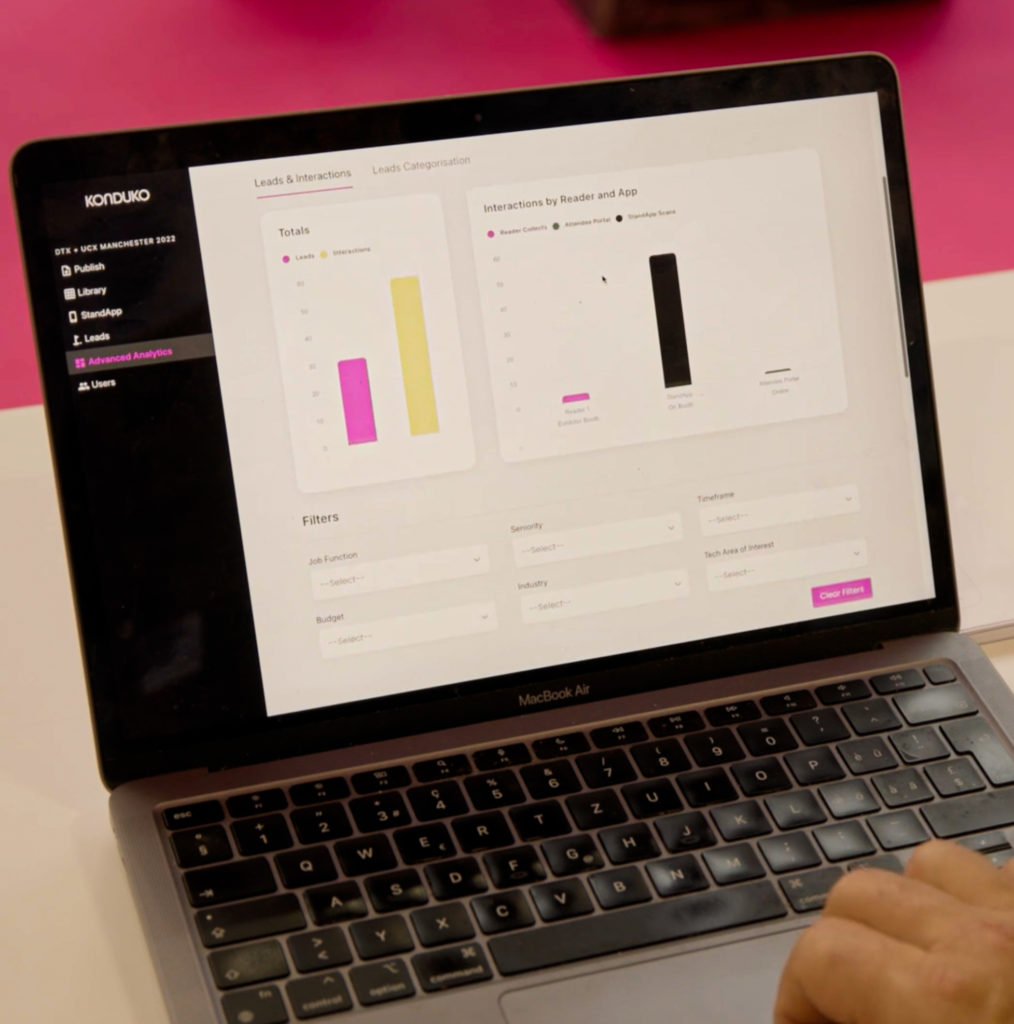
For sales rebooking at the event, you need an indicator that the Exhibitor is performing well to understand if they are likely to rebook at the event or not. The key to this is having real-time engagement data from the show floor. By understanding the inbound traffic that an Exhibitor is getting, and the leads that come as a result, you can monitor averages and see who is above and below that level.

Factoring in stand size can help – ie. creating a metric for ‘average leads per square metre’.

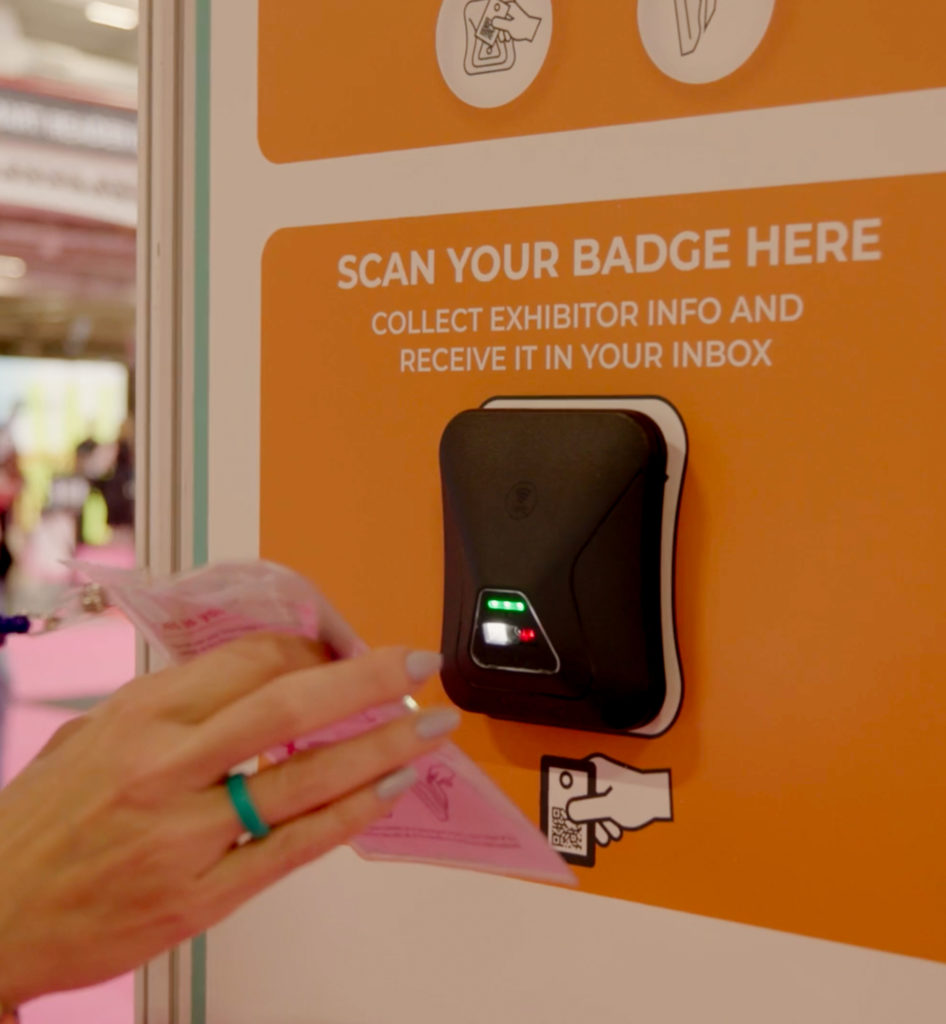
Konduko’s ability to capture attendee interest from Badge Readers, and to off-load this data in real-time makes it a primary tool for delivering this insight.

Another method for improving rebooking, is to be able to identify the Exhibitors that are underperforming and to offer support and advice before the end of the event.

Active monitoring of Exhibitor Success and deployment of Sales Teams to address low performance during the event, can be the difference in retaining the Exhibitor. Identifying high-performers with real-time data will demonstrate your ability to provide and prove value.

Therefore, having live data analysis pushed to sales-people with specific objectives on day 2 and 3 of the event can help triage issues that may have caused dissatisfaction if not addressed during the event.

Gather industry insights and trends

Understanding what attendees discovered at the event and which products were more popular than average can help you to spot industry trends.

Assess which product categories attendees declared an interest for in registration, then compare this to their show floor interactions. Consider which categories were most popular compared to their representation on the show floor, and which categories attendees expected to be interested in compared what they actually expressed interest in.

This can provide useful insights into what grabbed attendees’ attention that they hadn’t considered before the event, and emerging trends for both speaker content and product categories on the show floor. Also, which products attendees were looking for which perhaps weren’t well represented.

By combining declared interests from registration with Reader interaction, lead capture and session attendance data from the show floor, you can build an accurate picture of which products are over-indexing and under-indexing with attendees.

The key to this is in category planning. By assigning product categories to Exhibitors and sessions, and using the exact same categories for registration interest, you allow the datasets to combine into a piece of trend analysis.

And be mindful that without this up-front planning and matching, your investment in implementing and collecting data from the different sources may go to waste. Especially if attendee interest categories differ from Exhibitor product categories.

Summary

Show floor behavioural data can be highly valuable to providing insights that can help you identify sales targets and shape your show to draw the most attendees that will engage with your Exhibitors.

Konduko provides this data by allowing attendees to collect digital information from the show floor. We find this provides a much larger sample of data (65%-95% of attendees) than other methods. Lead retrieval data, meeting scheduling and methods of show-floor tracking can also provide you with samples of data that can inform the analysis discussed here.

We recommend that you take a systematic approach to identifying the questions you want to answer with the data and consider what data you have to answer it. What data collection activities can you deploy to get you bigger samples of data which will increase the quality of your results.